Answers for Coach
Questions the Talkin' Baseball hosts asked on air and couldn't answer, settled with data going back to 1903.
- Answered
- 3
- Data from
- 1903
- To go
- 41
Data it uses
The data lake →- The show's questionsOn hand
- Game resultsOn hand
- StandingsOn hand
- Relief pitchingOn hand
- Every pitchOn hand
Could use later: Game logs, Play-by-play
Across 848 questions the Talkin’ Baseball hosts asked on air without an answer, 230 were the kind data can settle. They boil down to 44 research questions. These are the first three, each tested over decades of games against a league baseline, never a single season. All 44, with what’s next, are on the question board.
Is home field real in the postseason?
“Seven of the last eight home teams playing in Game 7 have taken the L. Is there more pressure at home, or is that just straight up luck?” — Trevor
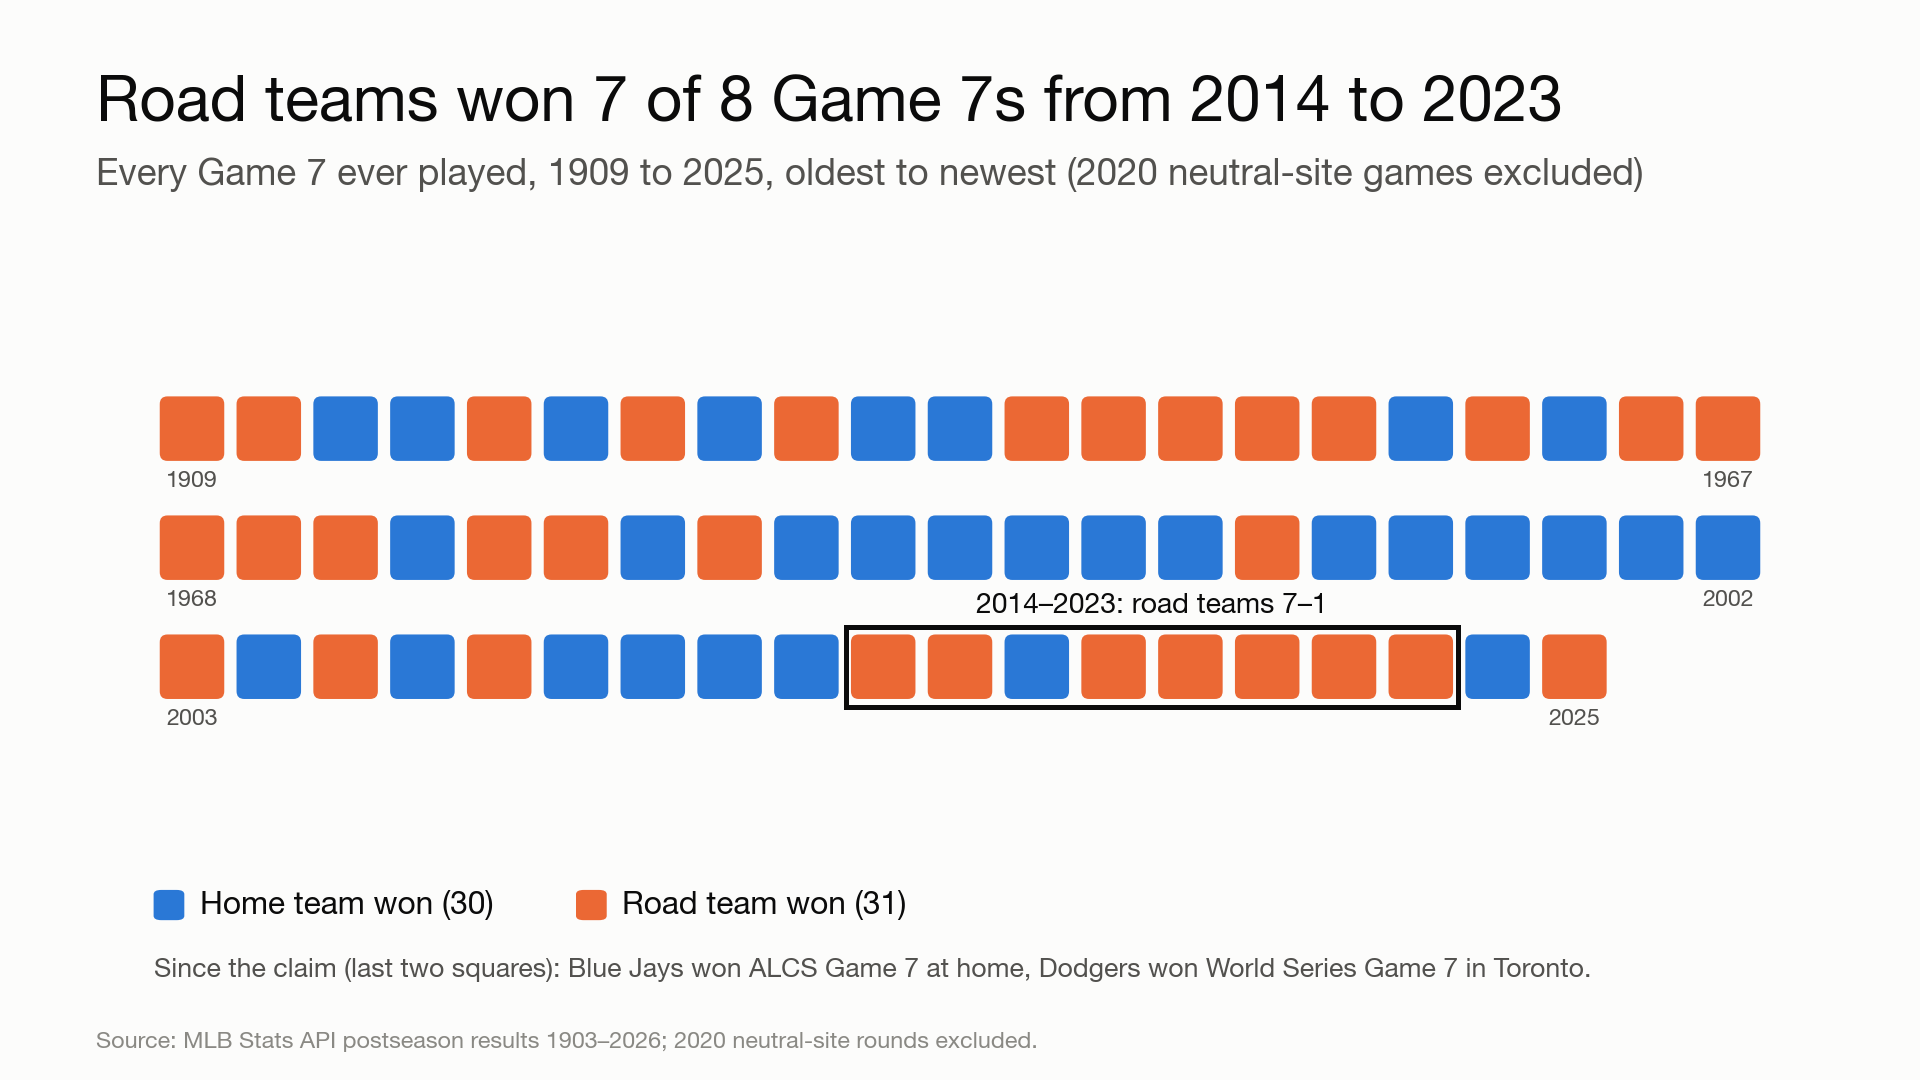
The claim is true. Road teams won 7 of 8 Game 7s from 2014 to 2023. Given who played, that had about a 1.7% chance.
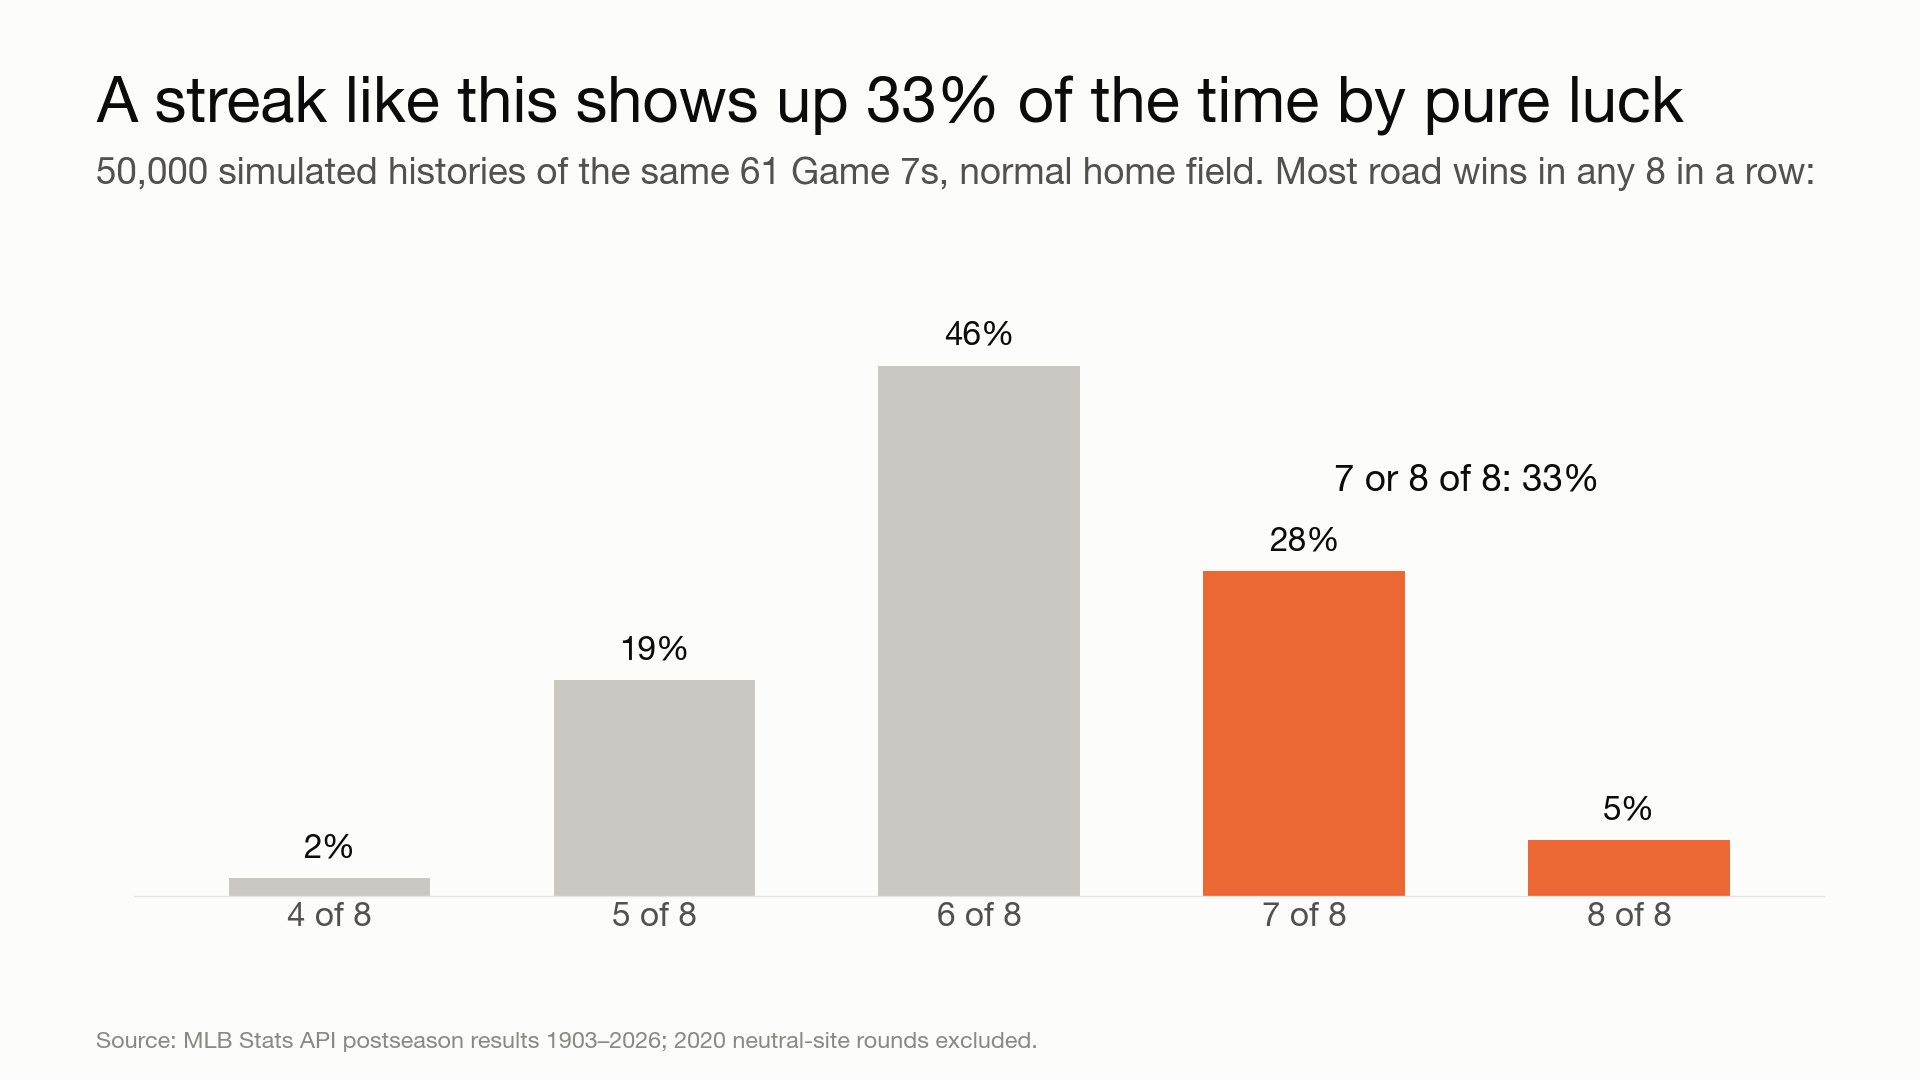
It’s still probably luck. Across all 61 Game 7s, some run of 8 with 7+ road wins shows up by chance 33% of the time. You only notice a streak after it happens. The all-time Game 7 record: home teams 30–31.
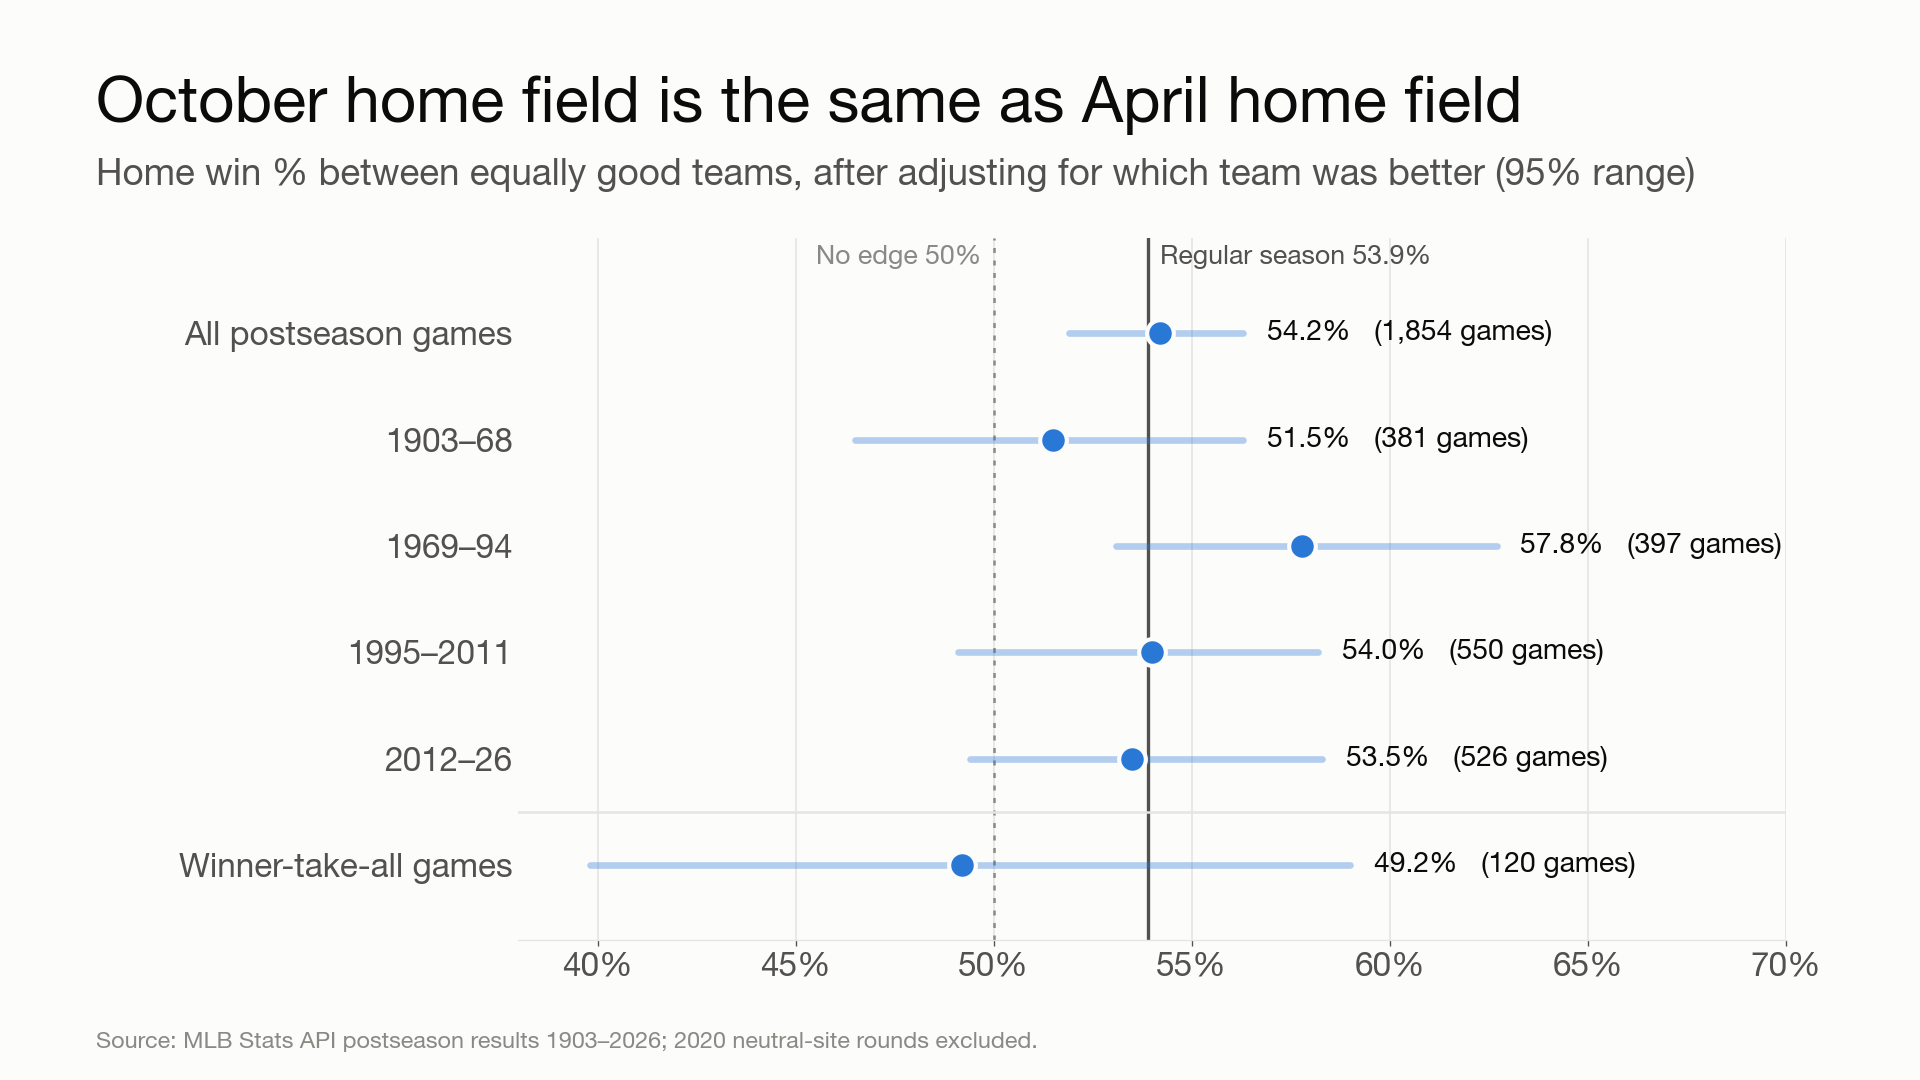
Home field in October is the same as home field in April. Since 1903, home teams won 54.4% of postseason games. Adjusted for team quality, the edge is 54.2%, against 53.9% in the regular season.
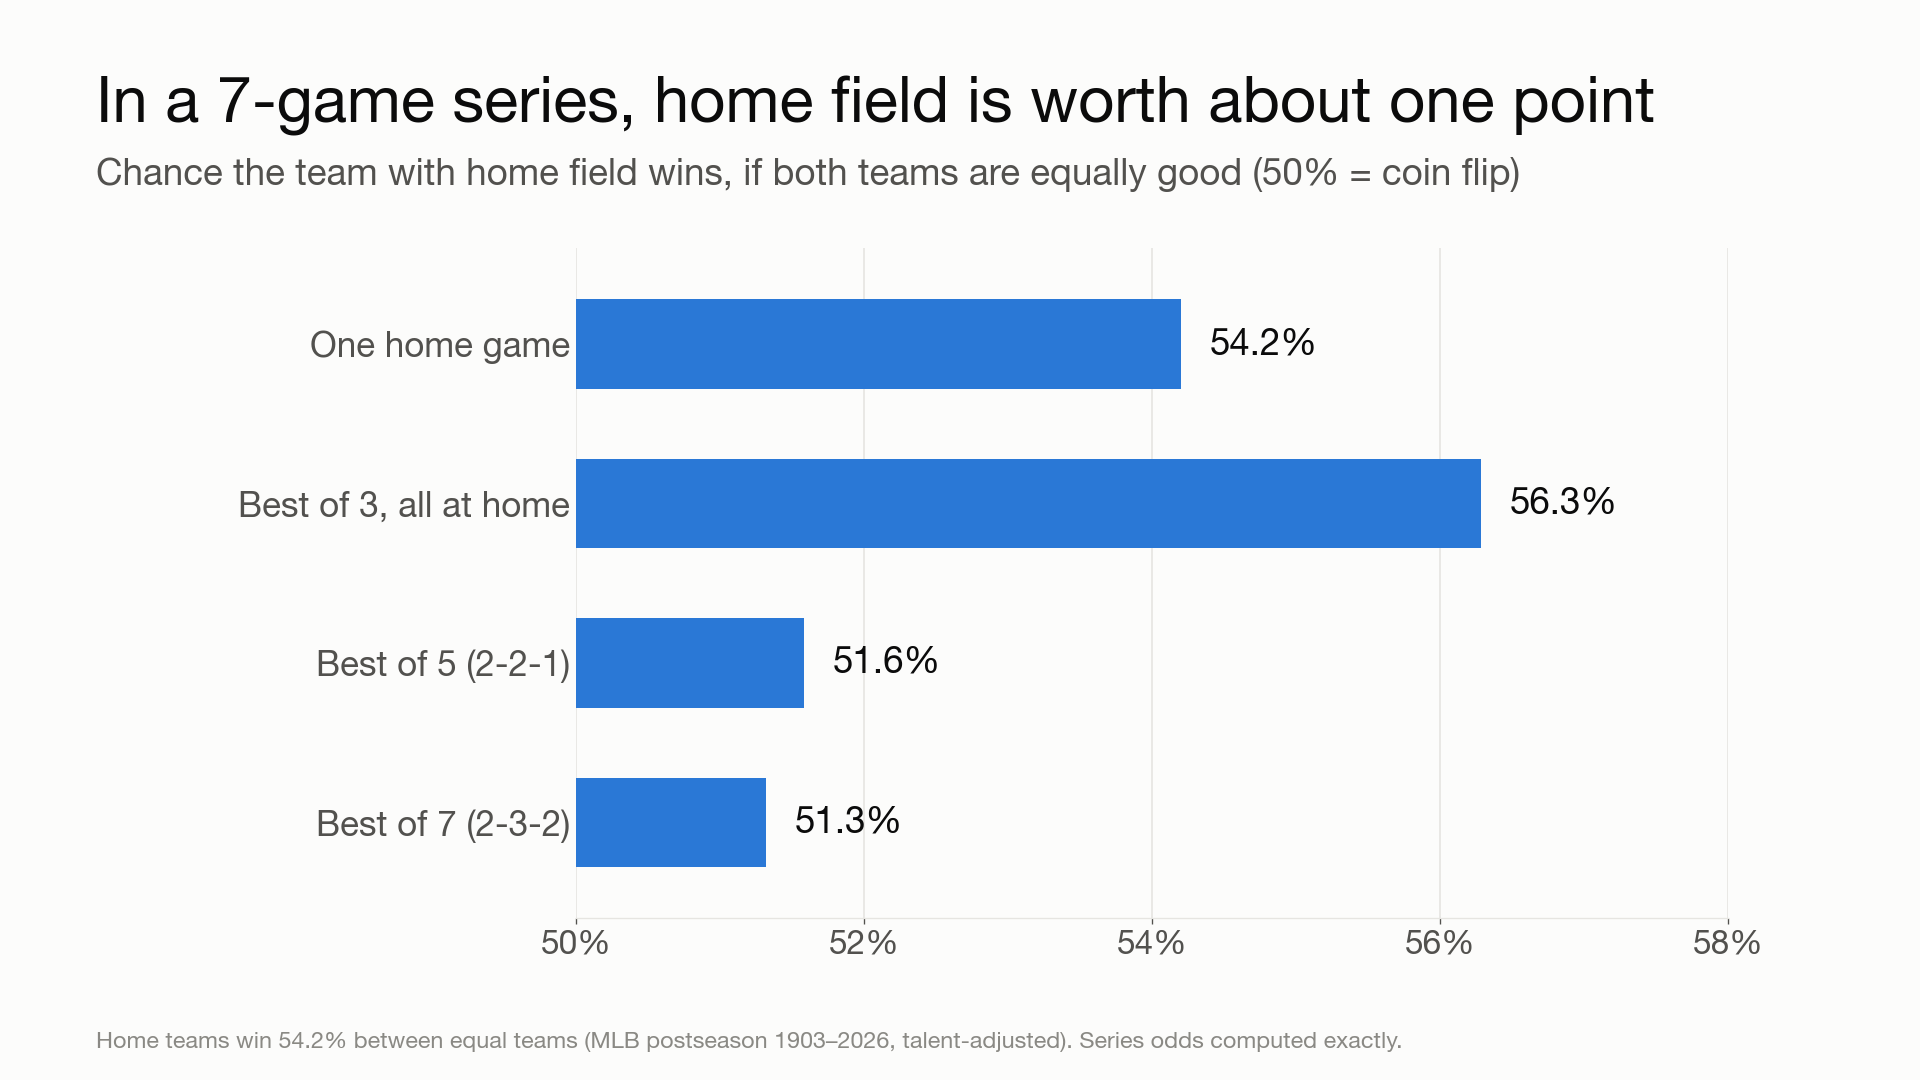
Why it barely registers in a series: with equal teams, a 54% home edge makes the better seed a 51.3% favorite in a best-of-7. Alternating venues cancel it out, and only the extra home game counts.
Are one-run records skill or luck?
“15–36 in one-run games. What’s going on there?” — Jake, on the 2025 White Sox
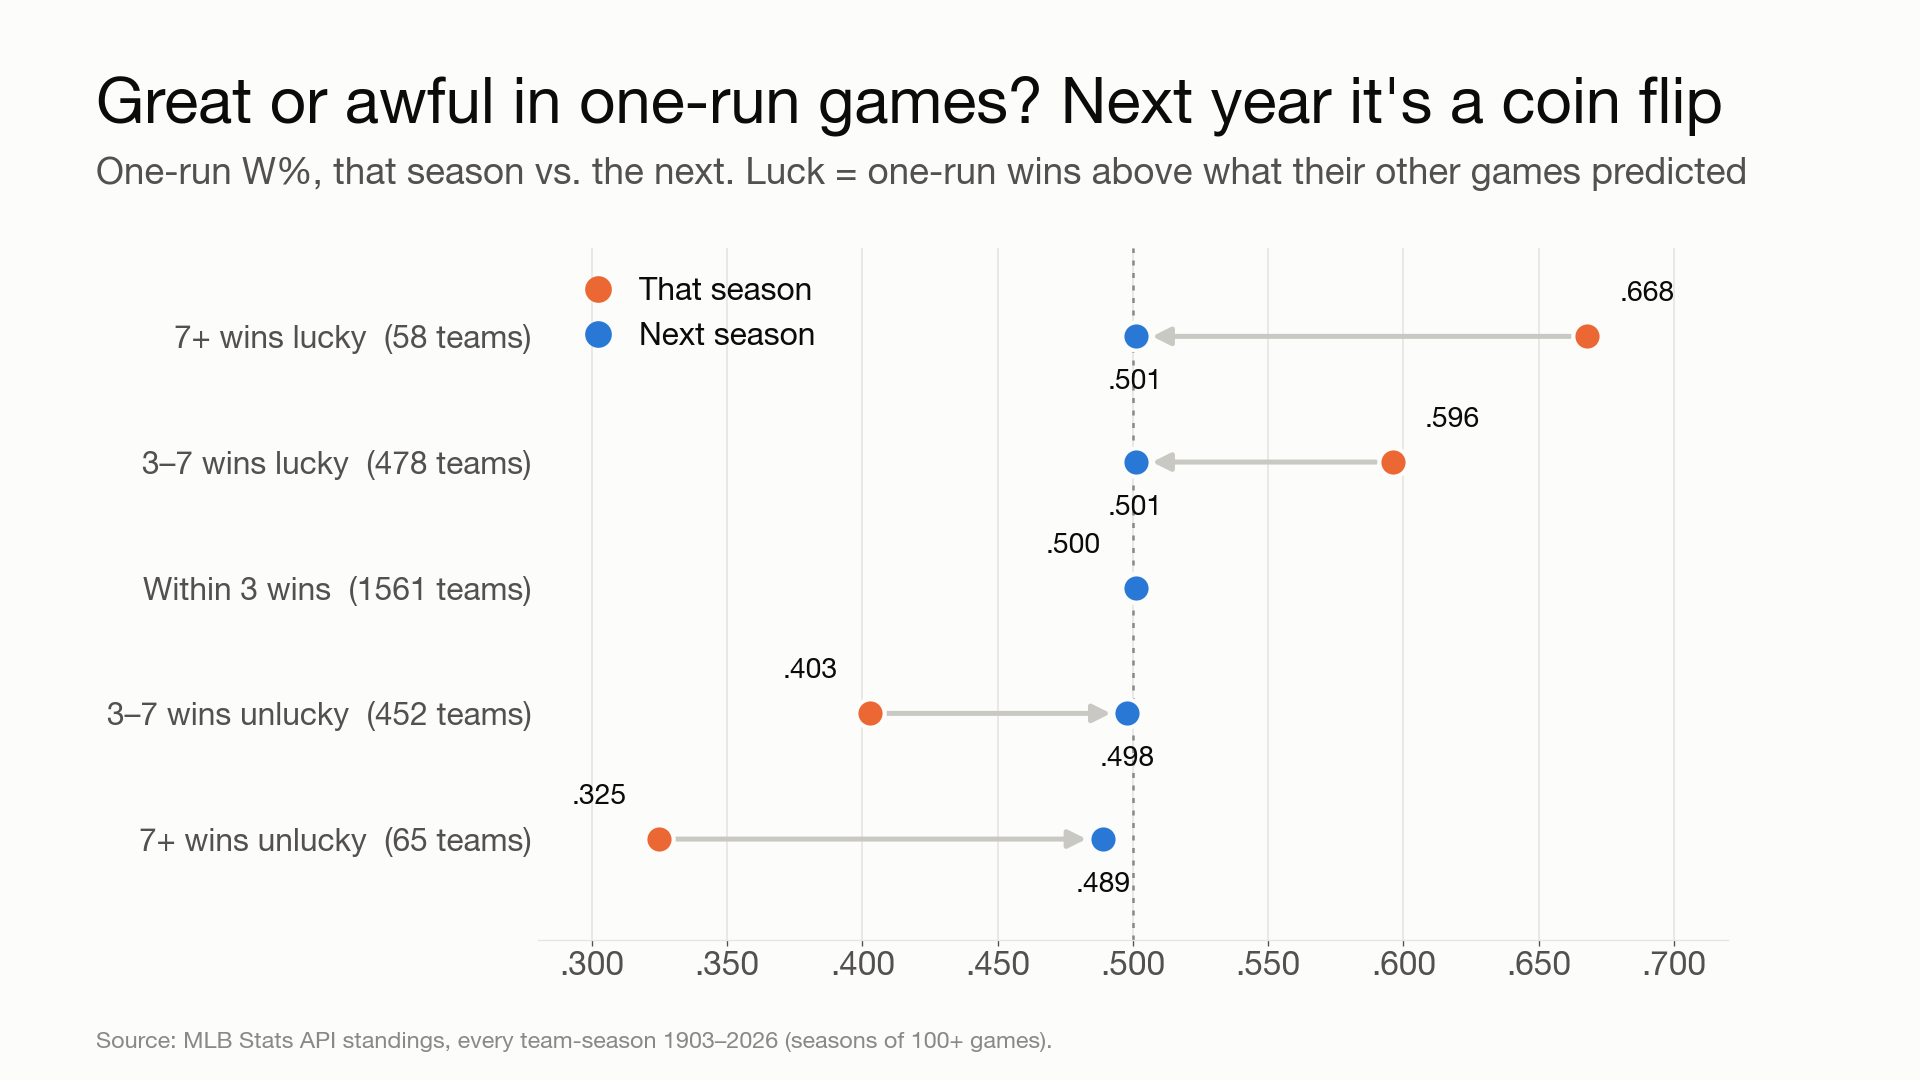
Almost entirely luck. Over every team-season since 1903:
- Talent shows up in one-run games at about a third of full strength. A .600 team plays about .531 in them.
- Teams’ one-run luck varies by 3.55 wins a season. Pure coin flips over the same games would give 3.43.
- It doesn’t carry over. The year-to-year correlation is 0.005. Teams that were 7+ wins lucky went .668 in one-run games, then .501 the next season.
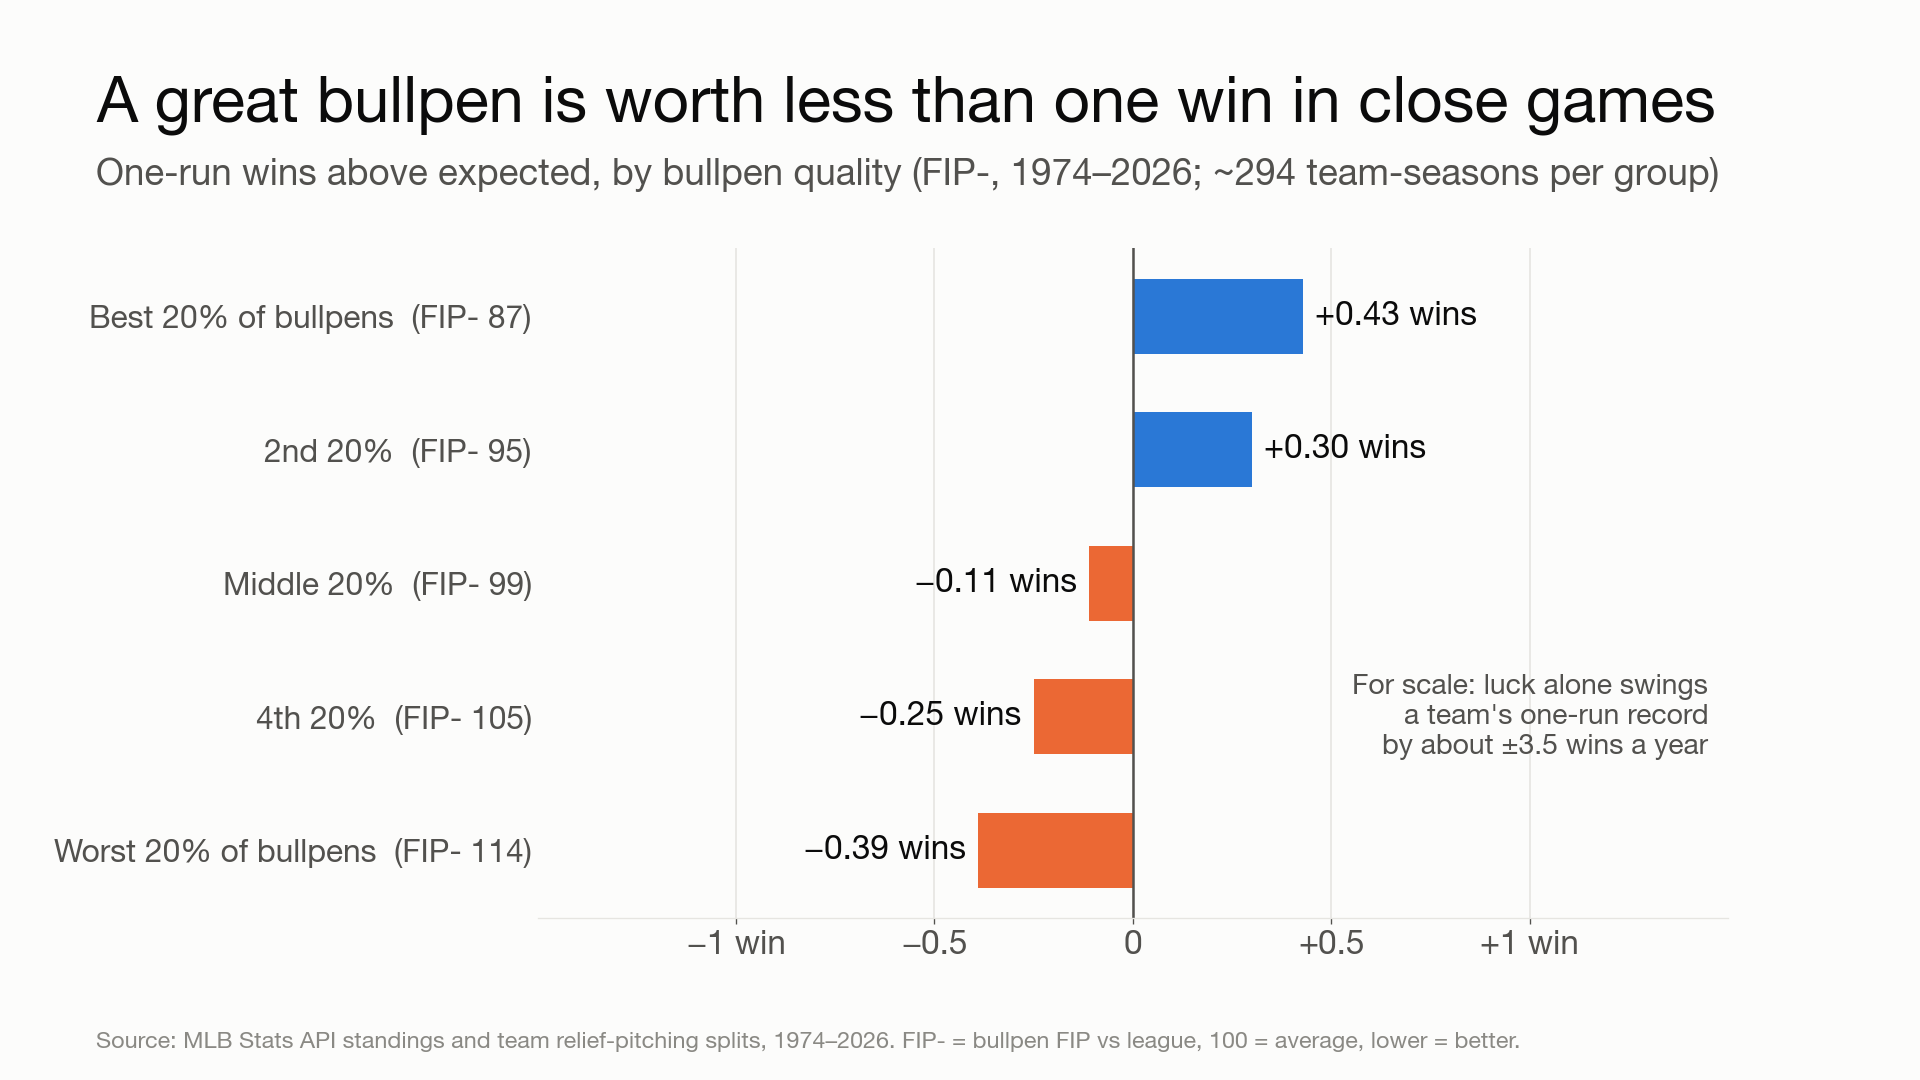
- Bullpens matter, but barely: the best fifth beat expectation by less than half a win a year.
The 2025 White Sox were 9 wins unlucky in one-run games. In 2026 they went 25–22 in them and made the playoffs.
Was the Red Sox’s 31–5 the best 36 games ever?
“That’s a wild stat. Is that real?” — Trevor
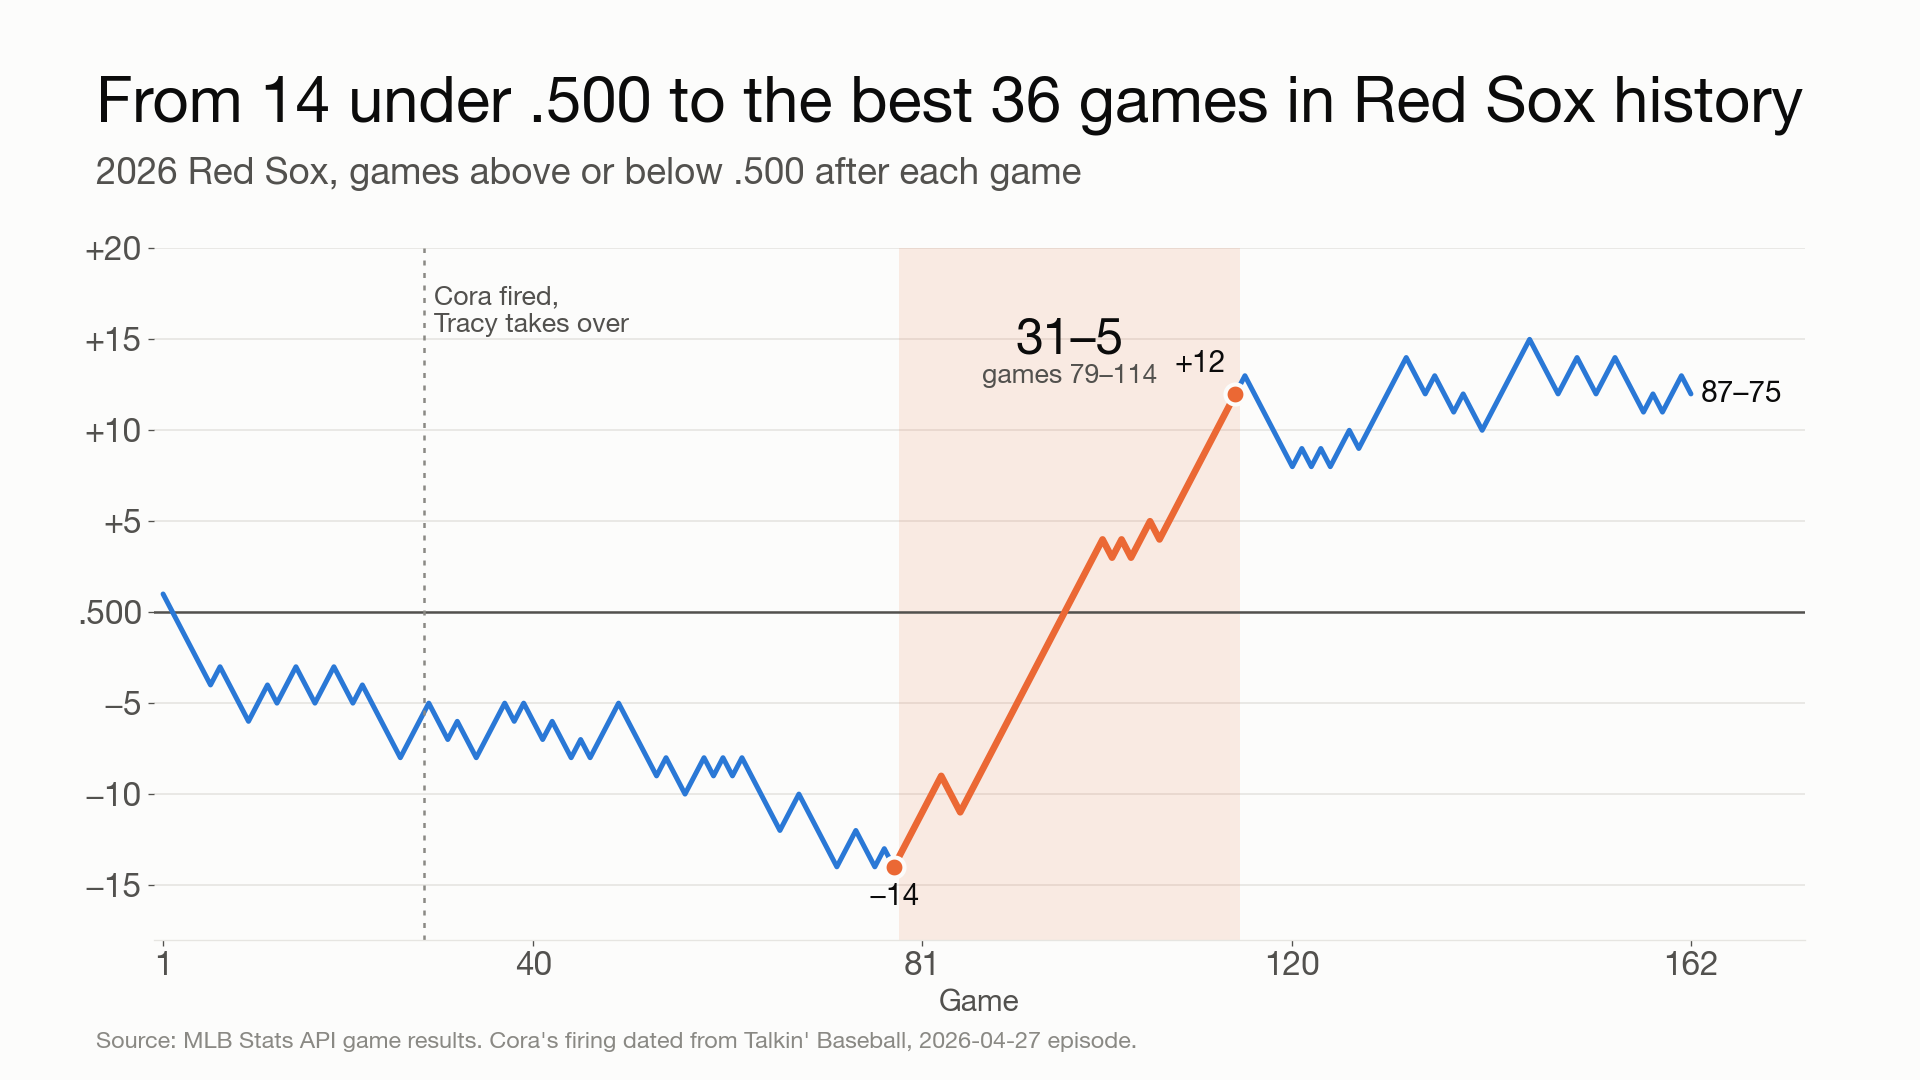
“Best ever” is false. Six AL/NL teams had a better 36-game run, led by the 1906 Cubs at 34–2, and 14 others tied 31–5.
What is true is better:
- It’s the best 36-game stretch in Red Sox history.
- No team has ever gone 31–5 from that far below .500. They started it 14 under; the next-worst start was 4 under.
- For a true 87-win team it’s a 0.13% chance, so during those 36 games they probably were better than their record.
Tracy, or the lineup? Mostly the lineup. The run started 50 games into Tracy’s tenure. Scoring jumped about 1.7 runs a game during the stretch and fell right back after, as four regulars got hot at once and the weakest bats lost their playing time.
How it’s built
Python over MLB Stats API results back to 1901 and Statcast pitch data from 2022 on. Each question has its own analysis, charts, and a draft video script.