Tunnel Vision
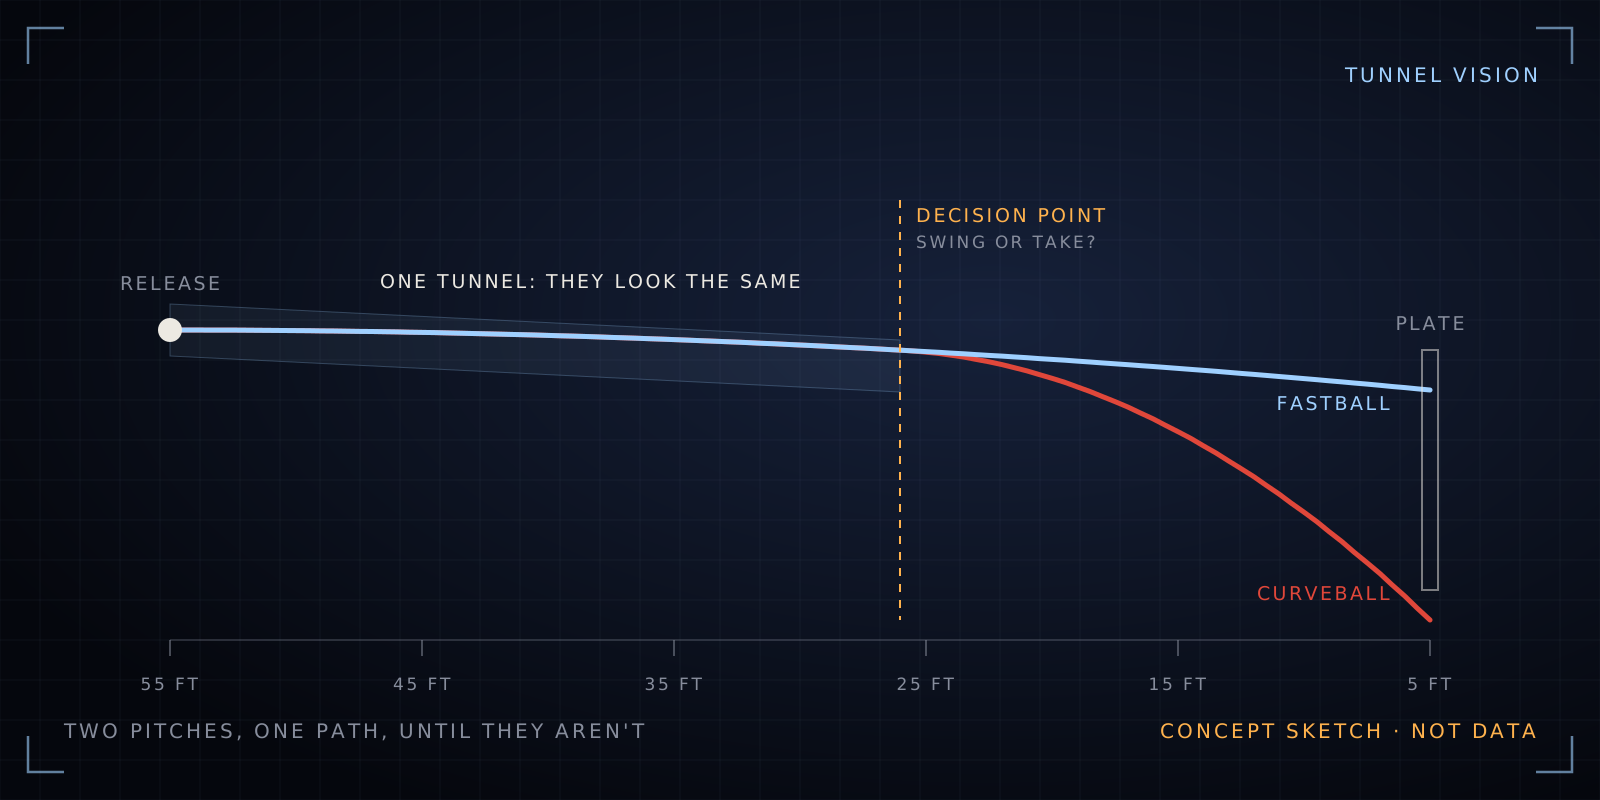
Two pitches that look identical until they don't. An interactive flight path that shows how long a pitcher's pitches stay in the same tunnel.
- Coach questions
- 3
- Asked on air
- 15×
- Top question
- Q-14
Coach questions it could answer
The playbook →- What drives in-season velocity swings, and does velocity come back?
Compare a pitcher's tunnels on high-velocity and low-velocity days. If the pairs split earlier when velocity is down, it shows what a velocity dip costs beyond the radar gun.
- Do unusual arm angles and deliveries make pitchers better?
Measure how long each pitcher's pairs stay together, grouped by arm slot. If unusual slots keep pitches tunneled longer, that's a mechanism for why they work, not just a correlation.
- Do pitchers throw their best pitches in the right spots?
Draw where each pitch finishes against where its tunnel partner does. A pitcher locating well keeps pairs tight until late and splits them toward the edges, not the middle.
Data it needs
The data lake →1 of 2 on hand; the rest arrives in phase 2, Every pitch.
The question
“Tunneling” is the idea that a pitcher’s fastball and breaking ball look the same out of the hand and only separate after the hitter has to commit. How long do real pitch pairs actually stay together, and which pitchers are best at it?
How it would work
- Rebuild each pitch’s full flight from Statcast’s trajectory fit: release point, velocity and acceleration in three dimensions.
- Pair a pitcher’s fastball with his breaking ball thrown in similar counts, and measure the gap between the two paths every few feet from release.
- An interactive view lets you scrub along the flight from the hitter’s or catcher’s angle and watch the pitches split.
First version
- A 2D side and overhead view rather than 3D, so it works on a phone.
- One pitcher at a time, his two most-used pitches, average paths with a band for the spread.
- A leaderboard of how far from the plate each pitcher’s main pair stays within a fixed gap, with the threshold stated on the page.
The data
Statcast pitch-level release position, velocity and acceleration, and plate location, for every pitch since 2015.
What it needs
- A defensible “can’t tell them apart” line. The gap has to be measured as the angle a hitter sees, not inches, and the threshold should come from vision research, not a guess.
- A rendering approach. A 3D view in the browser, or a projected 2D view that’s simpler and works on phones.
Status
An idea on the launchpad. Nothing is built yet.