Glove Consensus
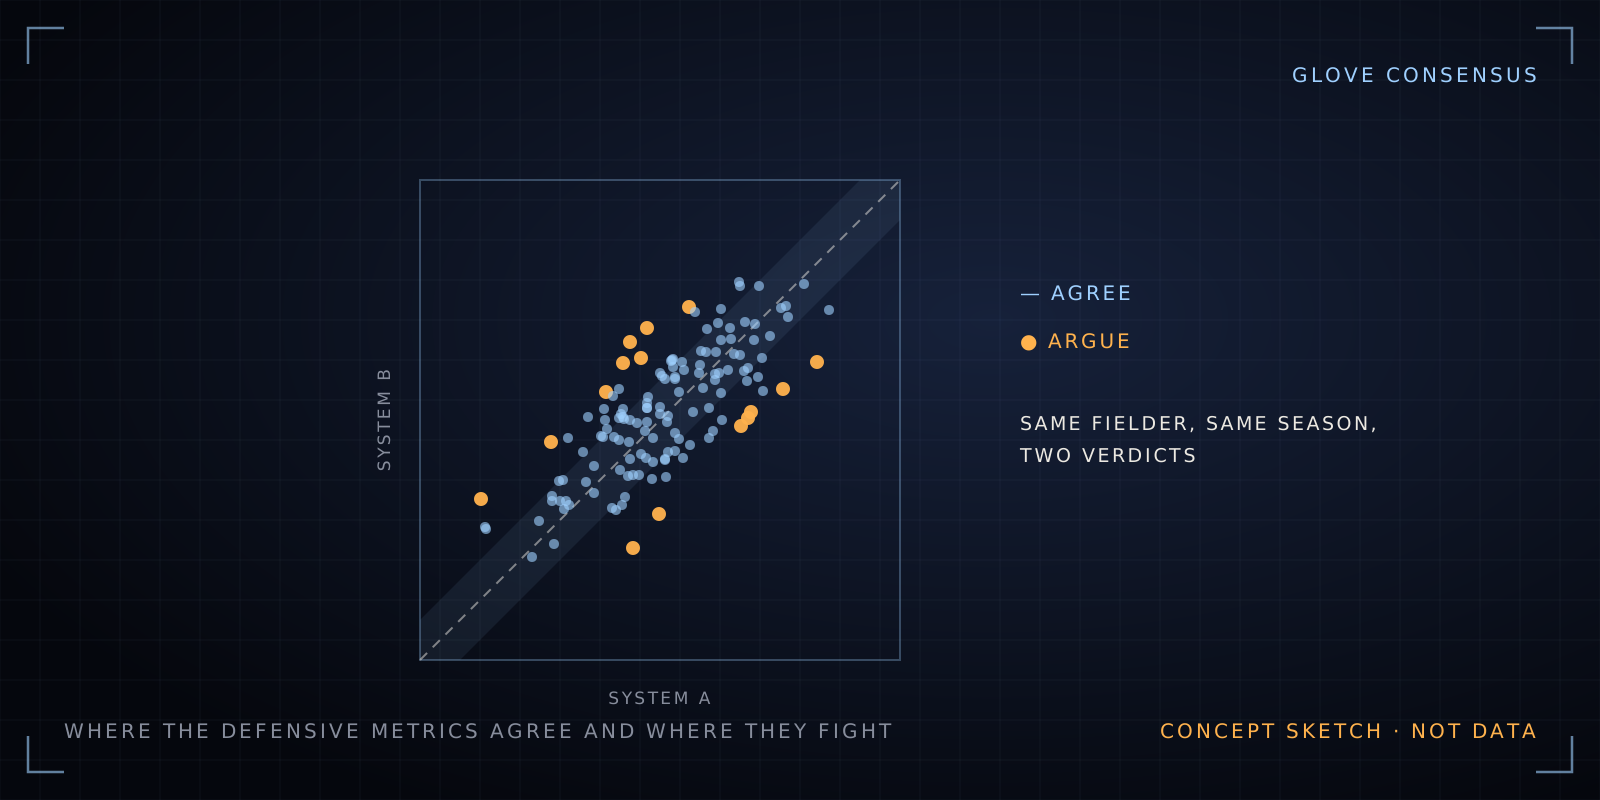
Defensive metrics often disagree about the same fielder. Plot them against each other and see who every system agrees on, and who starts arguments.
- Coach questions
- 4
- Asked on air
- 18×
- Top question
- Q-04
Coach questions it could answer
The playbook →- How reliable are defensive metrics, and do they agree?
Plot every fielder's rating in one system against another. Points near the diagonal are fielders everyone agrees on; the far ones show exactly where and by how much the systems disagree.
- Does WAR value defense and positions correctly?
Show how much of each player's WAR comes from defense and the position adjustment, and how far his WAR would move if a different defensive system were plugged in.
- How rare are the spectacular defensive plays we remember?
Use catch probability to count how many truly unlikely catches happen in a season, so the plays everyone remembers get a sense of scale.
- Are elite outfield arms disappearing?
Track the league's top arm strengths year by year to see whether elite outfield arms are actually thinning out.
Data it needs
The data lake →0 of 2 on hand; the rest arrives in phase 2, Every pitch.
The question
Two respected defensive systems can rank the same shortstop near the top and near the middle. Which fielders do the metrics agree on, which do they fight about, and does that disagreement change who looks like an MVP?
How it would work
- Line up each fielder’s rating in the major public systems at the same position and season.
- A scatter plot for any two systems, with a band where they agree; hover a point for the player and his numbers.
- A position view showing how much each position’s ratings spread across systems.
First version
- One season, all positions, two systems side by side with a correlation line and the ten biggest disagreements listed.
- A WAR sensitivity table: each regular’s WAR with each defensive system swapped in.
The data
Statcast fielding (outs above average, catch probability, arm strength) and the other public defensive systems’ season ratings.
What it needs
- Matching definitions. Systems count innings, positions and runs differently; they need to be put on one scale before comparing.
- Year-to-year reliability for each system, so the page can show which one is steadier, not just which disagree.
Status
An idea on the launchpad. Nothing is built yet.