Spray Atlas
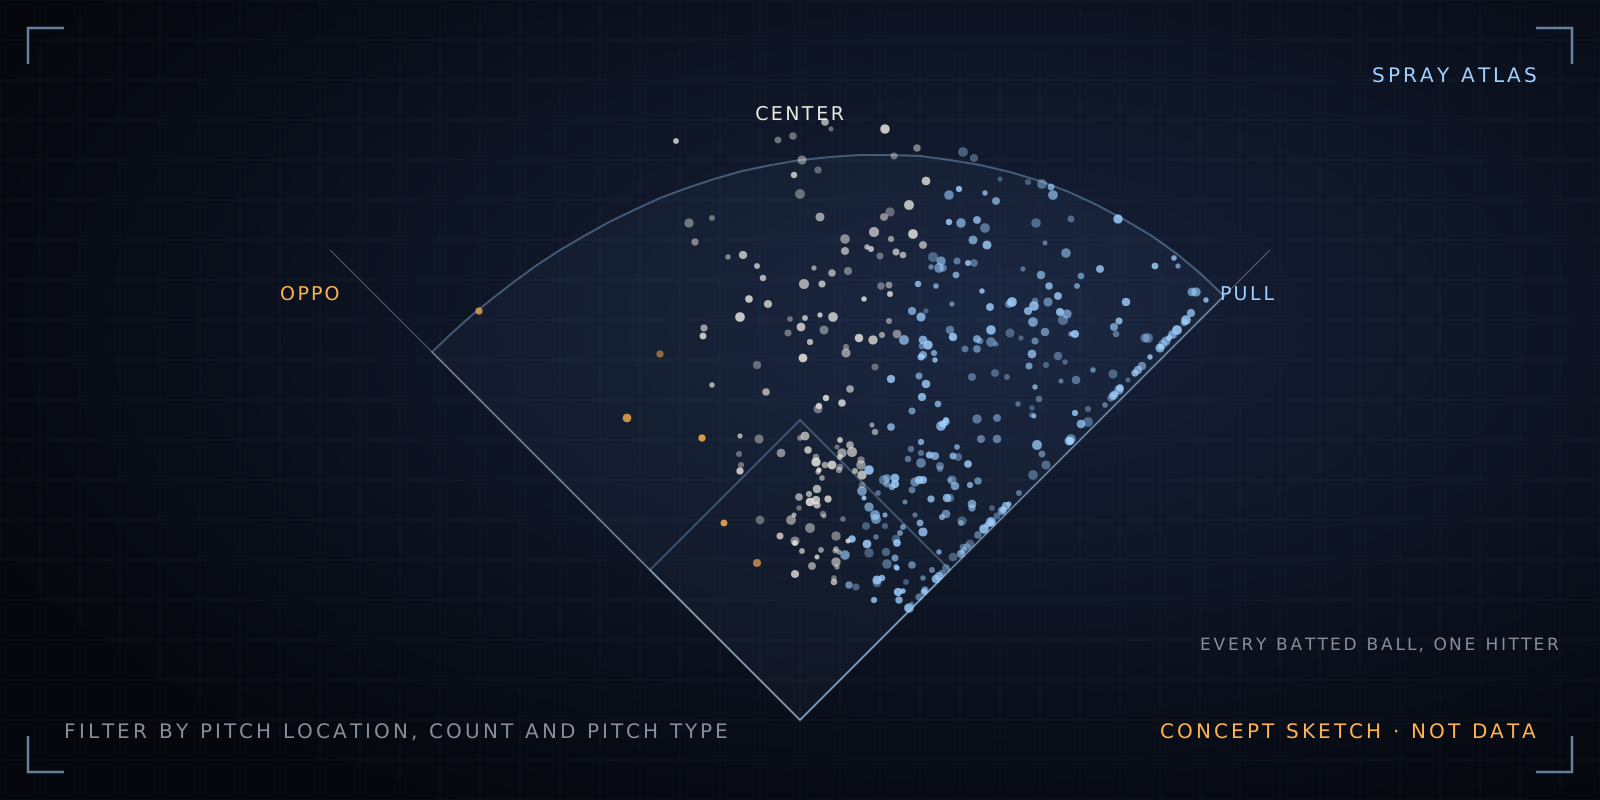
Every batted ball a hitter puts in play, on one field. Filter by pitch location, count and pitch type to see where he really hits it.
Builds on Read the Swing, Answers for Coach
- Coach questions
- 4
- Asked on air
- 18×
- Top question
- Q-05
Coach questions it could answer
The playbook →- Is a power outage the park, the luck, or the hitter?
Compare a hitter's pulled fly balls this year with past years. If the hard, pulled air contact is still there but stays in the park, look at the park; if it's gone, the hitter changed.
- What do bat-tracking metrics reveal about swings and hidden power?
Color batted balls by bat speed and squared-up rate to find hitters whose fastest swings land in the wrong part of the field, the hidden power the hosts keep wondering about.
- Does defensive positioning and relay choice actually save runs?
Overlay where fielders stood with where each hitter's balls landed, to show which positioning choices took hits away and which left holes.
- Does the playing surface change batted-ball and baserunning outcomes?
Split ground balls by park surface to see whether turf changes how often grounders get through, and where.
Data it needs
The data lake →1 of 2 on hand; the rest arrives in phase 1, The spine.
The question
Where does a hitter actually hit the ball, and how much does that depend on where the pitch is? Inside pitches get pulled and outside pitches go the other way, but how strongly, and for whom?
How it would work
- Every batted ball for a hitter drawn on a field from above, colored pull, center or opposite field.
- Filters for pitch location, count, pitch type and exit velocity, with the league as a backdrop for comparison.
- A side-by-side mode for two hitters, or one hitter across two seasons.
It’s also a window into Read the Swing: that game’s no-video baseline uses exactly this kind of hitter tendency plus pitch location, and it gets about 46% right on the game’s clips.
First version
- One season, one generic field, any qualified hitter.
- Three filters: pitch location (inner, middle, outer third), count ahead or behind, and pitch type.
- Pull, center and opposite-field rates beside the chart, against the league.
The data
Statcast batted balls with hit coordinates, launch angle and exit velocity, 2015 onward. Answers for Coach already keeps a pitch-level Statcast cache for 2022–26.
What it needs
- Fast drawing. A full season can be 500 batted balls per hitter and hundreds of hitters, so the field needs to render quickly on a phone.
- Park shapes. Fences differ by park; a single generic field is the first version.
Status
An idea on the launchpad. Nothing is built yet.