Leverage Ledger
A closer's 70 innings can matter more than a starter's 180. Weigh every relief appearance by how much the game was on the line, and see what WAR leaves out.
- Coach questions
- 2
- Asked on air
- 12×
- Top question
- Q-10
Coach questions it could answer
The playbook →- Are high-leverage relievers worth more than their WAR says?
Put each reliever's WAR next to his win probability added and a leverage-weighted value. The relievers whose bars disagree most are the ones WAR undersells or oversells.
- How has the starter-reliever workload split actually evolved?
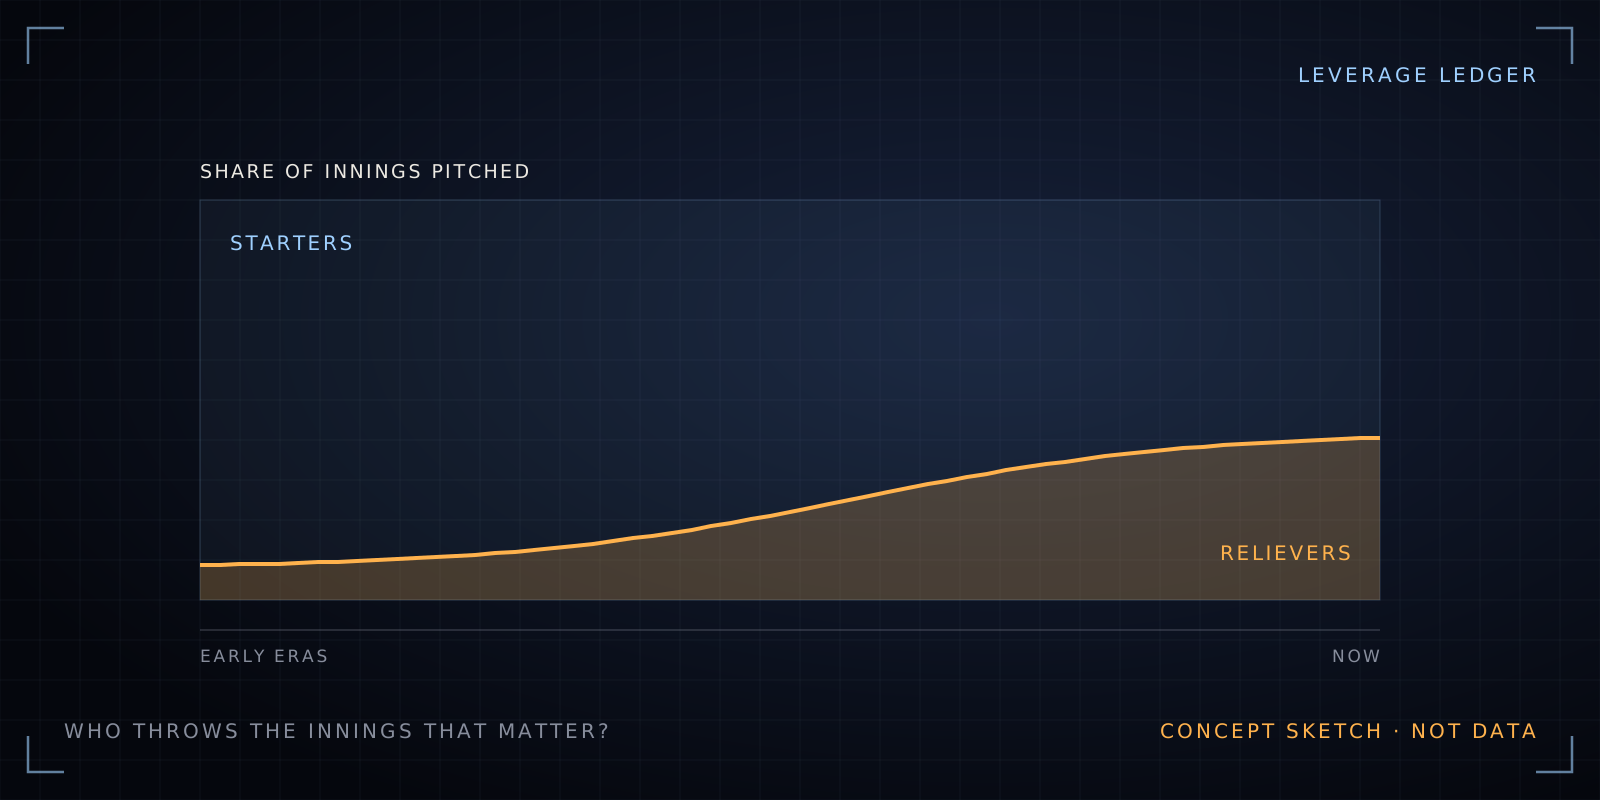
Chart the share of innings thrown by starters and relievers every season, with the high-leverage innings highlighted, to show how the split evolved and where the important innings went.
Data it needs
The data lake →1 of 2 on hand; the rest arrives in phase 1, The spine.
Could use later: Play-by-play, Relief pitching
The question
Relievers pitch few innings, so their WAR stays small. But a reliever’s innings tend to come when the game is close and late, when one out matters far more than in a blowout. How much is that worth, and has the job moved from starters to bullpens?
How it would work
- Win probability added for every relief appearance: how much each pitcher moved his team’s chances.
- A leverage-weighted value alongside WAR, so the two can be compared pitcher by pitcher.
- An era view: starter and reliever shares of innings and of high-leverage innings, season by season.
First version
- This season’s relievers, three bars each: WAR, win probability added, and leverage-weighted runs saved.
- The era chart from the earliest seasons with complete play-by-play.
The data
MLB Stats API play-by-play with game state, for win probability and leverage, plus season pitching stats.
What it needs
- A win probability model. It has to be built from play-by-play or taken from a documented public table, and stated on the page.
- Care with “clutch.” Win probability added credits the moment, not the skill; the page should say what’s skill and what’s timing.
Status
An idea on the launchpad. Nothing is built yet.