Prime Time
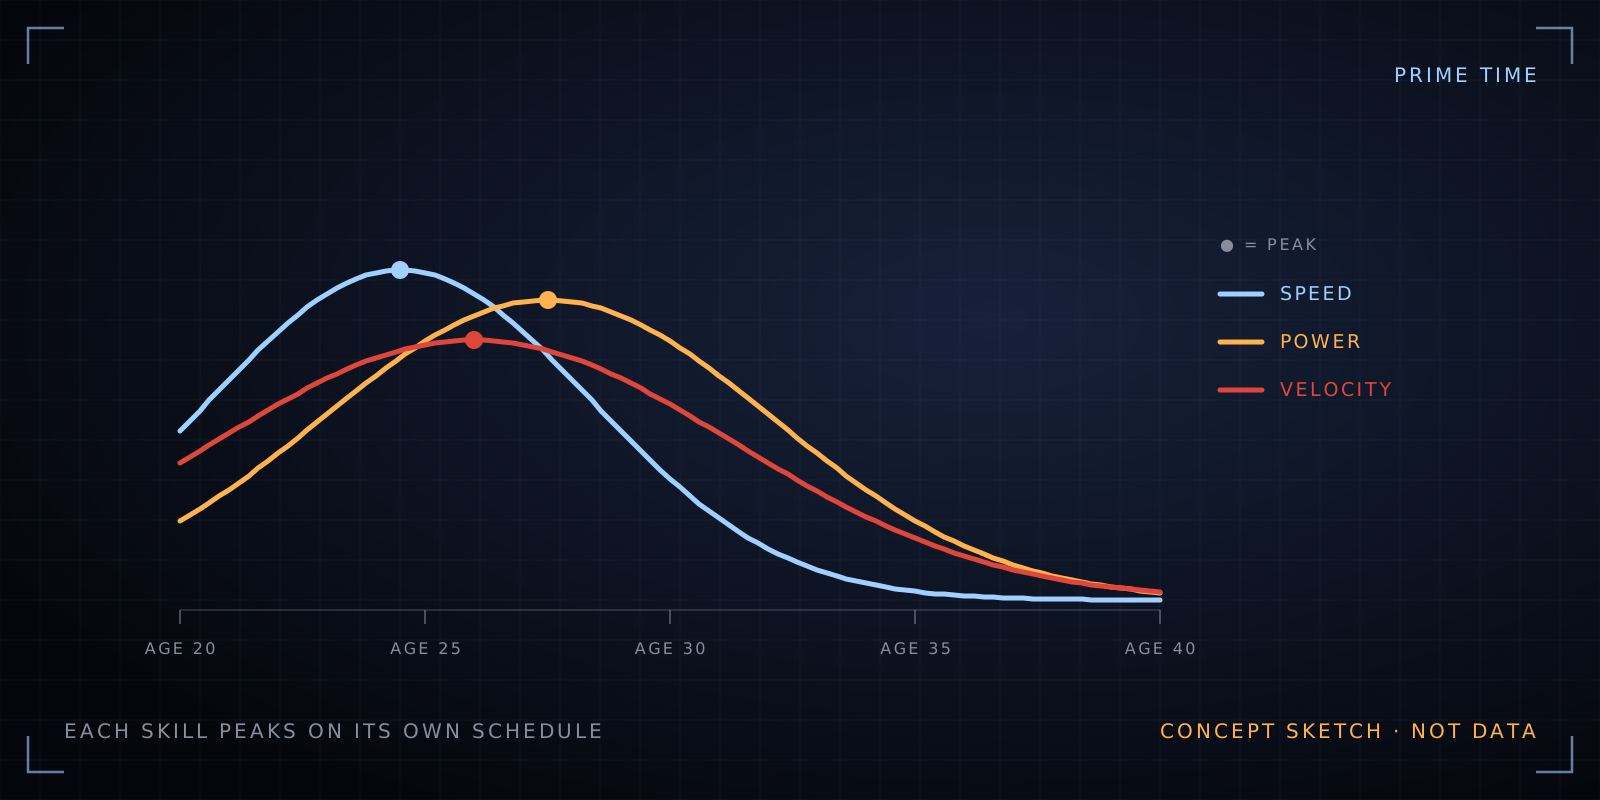
Power, speed and pitching don't peak at the same age. Draw an aging curve for each skill and see where any player sits on his.
- Coach questions
- 2
- Asked on air
- 7×
- Top question
- Q-22
Coach questions it could answer
The playbook →- Do power, speed and pitching skills age on different curves?
Build separate aging curves for sprint speed, power, plate discipline and pitch velocity from year-to-year changes in the same players, and show where each skill peaks and how fast it fades.
- Which early-career signals predict a prospect's future?
Put young players on the curves to separate skills that are still rising from ones already at their peak, a second angle on which early numbers mean something.
Data it needs
The data lake →1 of 3 on hand; the rest arrives in phase 2, Every pitch.
The question
“He’s 31, he’s in his prime” mixes skills that age very differently. Speed starts fading early, power often holds later, and pitching velocity follows its own path. When does each skill peak, and how fast does it decline?
How it would work
- For each skill, compare the same players from one season to the next, age by age, and chain those changes into a curve.
- Correct for the players who drop out of the league, who would otherwise make the curves look too kind.
- Pick a player to see his own numbers drawn against each curve.
First version
- Four curves: sprint speed, power, walk rate and fastball velocity.
- Any active player on top of them, with a note on how many players each age is built from.
The data
Statcast sprint speed and pitch velocity since 2015, and season stats for power and plate discipline going further back.
What it needs
- Survivor bias handled. Players who decline fast leave the league, so the method has to account for the ones who aren’t there the next year.
- Era effects. Training and usage change over time, so curves from 1990 and 2020 may differ, and the page should show that.
Status
An idea on the launchpad. Nothing is built yet.